Following a recent lab visit, I thought it was worth writing a quick post to share an example of how labs sometimes incorrectly calculate yield strength. While visiting a testing lab for unrelated issues, my colleagues and I were discussing how the customer runs both continuous and discontinuous material with the same method (Non-YPE and YPE). For historical reasons, they have updated their Series IX methods to Bluehill 3 with little knowledge of why, when or by whom the methods were setup.
It later transpired in the conversation that some of the lab's material was falling below their specification for yield strength. They are required to test every coil of product before shipment; therefore, materials not meeting the yield strength requirement are of major concern. The material has had to be reworked in the past in the hopes that the yield strength could be increased slightly. Otherwise, the material would be scrapped.
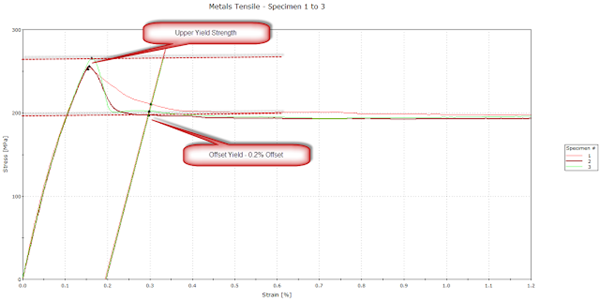
The calculation used for both continuous and discontinuous material was an offset yield of 0.2% strain. Based on this calculation the stress values were determined for product verification. For a continuously yielding material, it is recommended to use the offset yield calculation. However, for a discontinuously yielding material, using this calculation would result in an inaccurate measurement of stress after a potentially significant load drop. The main international metals standards such as ISO 6892 and ASTM E8 both recommend using upper yield strength (ReH or UYS) to calculate this value correctly.
By changing the software algorithm to a different Bluehill 3 standard calculation, we were able to increase the calculated yield strength by around 10%. This meant they no longer had to rework the material as the higher stress values were always well within specification. This modification to their test method helped reduce testing turnaround time, increased the reported material strength, reduced shipment delays, and removed the need for costly and time-consuming reworking process.
The graph below shows an example of how the two calculations differ. The results of the offset yield calculation were on average 21% lower than the upper yield calculations. Checking that calculations are correctly evaluating data could result in a significant improvement of results. Often methods were setup and have not been reviewed on a regular basis.