Challenges of ASTM F2077 Testing:
- Machining/manufacture of test blocks to match specimen shape
- Monitoring of intradiscal height during test
- Assessment of mechanical failure during test
- Avoidance of self-heating in test blocks
- Maintaining load peaks at high frequency
- Test duration for in vivo tests
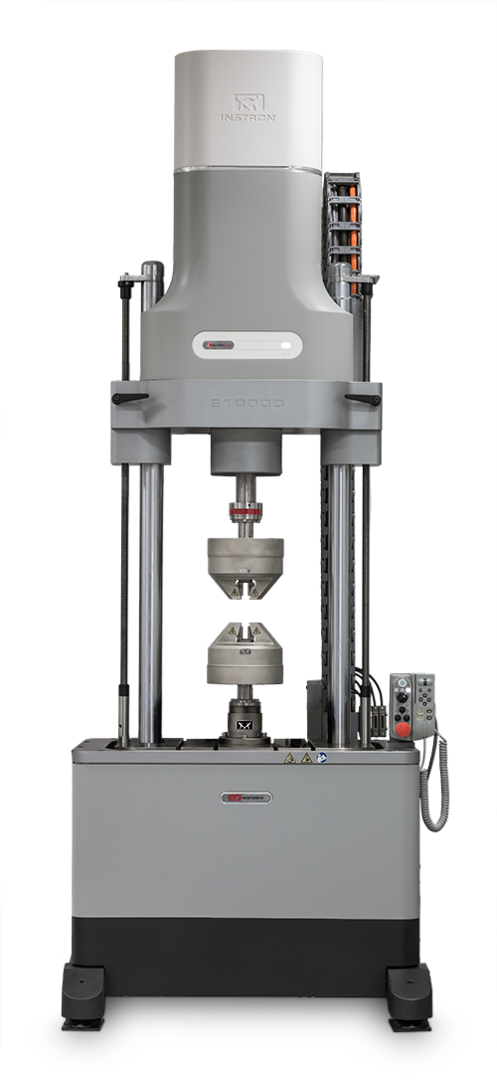
An axial-torsion system is required to encompass all test types from this standard and will allow manufacturers and researchers to conduct both static and fatigue testing on a range of implant designs with a single test system. The ElectroPuls® E3000 and E10000 Linear-Torsion All-Electric Dynamic Test Instruments, as well as the 8874 servohydraulic Dynamic test frame, all offer the necessary capabilities for testing to this standard with the use of specialised fixtures. Each system can be combined with a temperature controlled bath for simulation of in vivo conditions and Instron’s range of Biaxial Dynacell™ load cells can be mounted on the end of the moving axial-torsional actuator providing automatic compensation for errors caused by inertial loading.
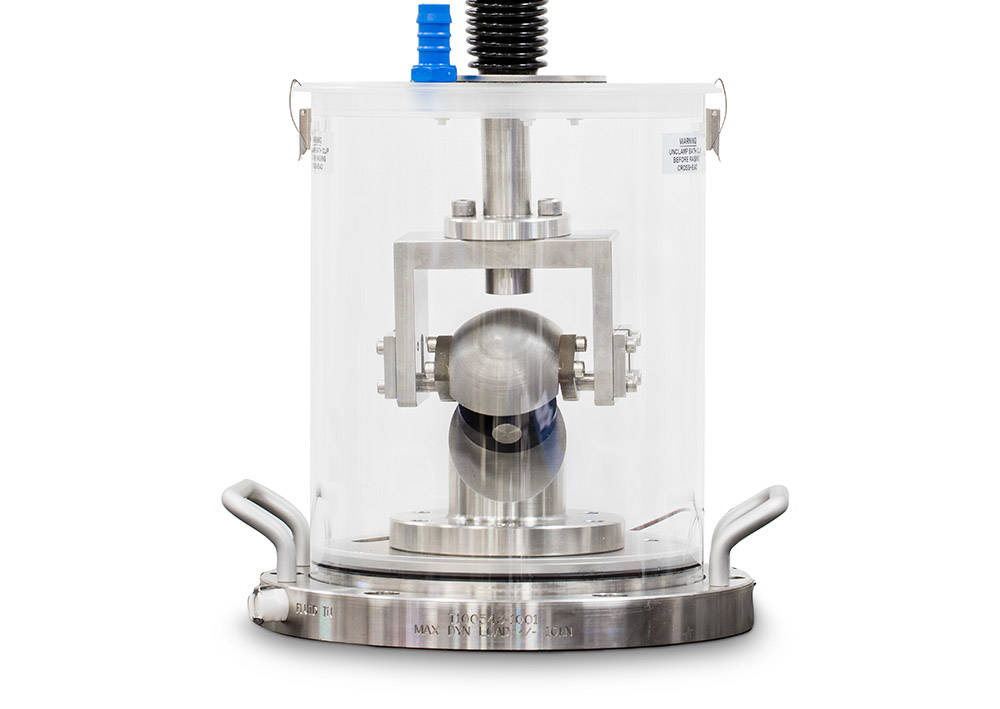
TEST FIXTURE
For both the Axial-compression and Compression shear tests the same fixture is used. This fixture connects to the system actuator via a universal joint and features a pushrod with an additional minimal friction sphere joint at its other end. The pushrod must be at least 38cm in length between the centre of each joint so as to compensate for any misalignment in the loadstring.
For the Torsion testing, the fixture is similar, with the lower joint type being the only difference. In this case, a spherical gimbal mechanism is used so that both a compressive force and moment can be applied to the specimen simultaneously.
For each test the specimen is held between two test blocks that are machined to match the specimens form and are rigidly attached to the fixture and test frame. The test blocks for the shear tests are machined such that the sample is held at the desired angle with respect to the table plane so that a shear force is created when an axial load is applied.
For static tests, the blocks are manufactured from metal and can be re-used. For the dynamic tests, blocks are manufactured from polyacetal and are single use.
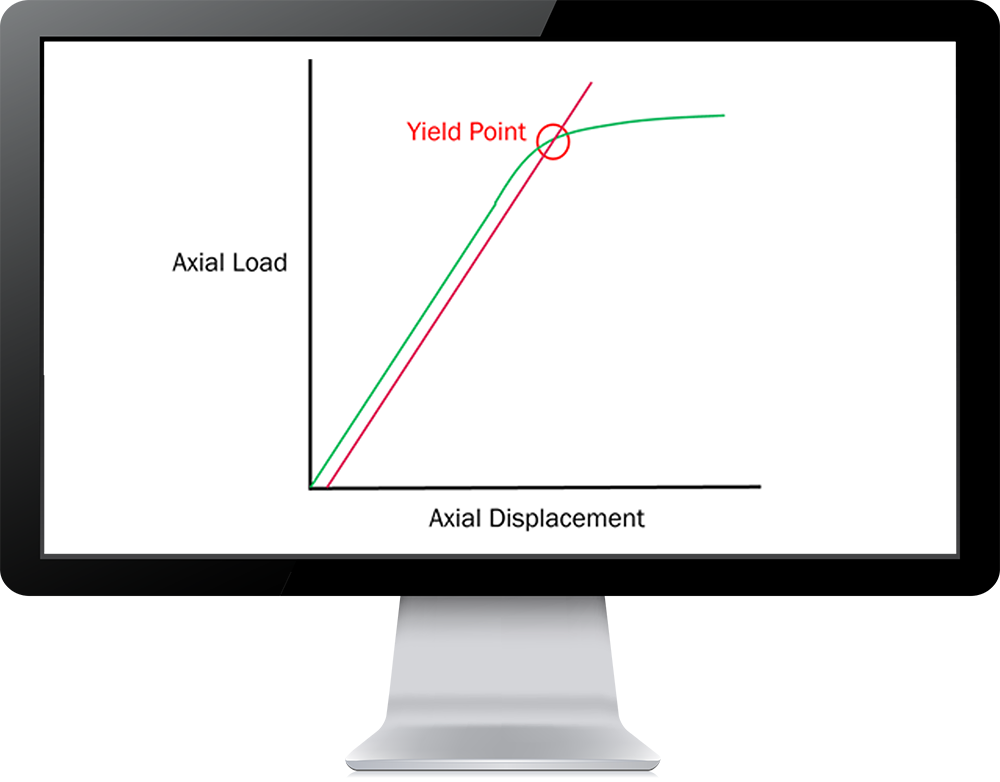
A simple Load vs. Displacement plot is used to characterise each sample for the Static tests.
Static Test Results Table (ASTM F2077)
| Specimen ID | Stiffness (N/mm) | Yield Displacement (mm) | Yield Load (N) | Ultimate Displacement (mm) | Ultimate Load (N) |
| Sample 1 | 10,134 | 1.32 | 11,218 | 1.74 | 14,238 |
| Sample 2 | 10,865 | 1.30 | 11,435 | 1.73 | 15,387 |
| Sample 3 | 11,012 | 1.27 | 11,562 | 1.69 | 13,890 |
| Sample 4 | 10,962 | 1.29 | 11,021 | 1.58 | 14,327 |
| Sample 5 | 10,377 | 1.31 | 10,934 | 1.67 | 15,764 |
| Mean | 10,670 | 1.30 | 11,234 | 1.68 | 14,721 |
| St. Dev | 350.26 | 0.02 | 238.16 | 0.06 | 722.56 |
For the Static torsion tests, a torque vs. angle curve is produced instead with a similar table providing the same mean and standard deviation values.
For the Dynamic tests, an SN curve with a minimum of 6 points is required for each specimen type, the aim being to identify the endurance life stress.
Dynamic Test Results Table (ASTM F2077)
| Specimen ID | Maximum Load (N) | Minimum Load (N) | Number of Cycles Achieved | Failure Mode |
| Sample 1 | 5,000 | 500 | 1,004,572 | Fracture |
| Sample 2 | 4,000 | 400 | 4,000,000 | Fracture |
| Sample 3 | 3,000 | 300 | 5,000,000 | Pass without Fracture |
| Sample 4 | 2,000 | 200 | 5,000,000 | Pass without Fracture |
| Sample 5 | 1,000 | 100 | 5,000,000 | Pass without Fracture |
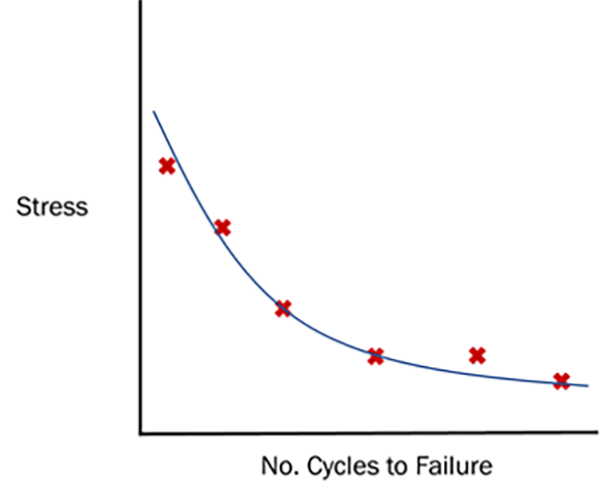
The data point from each sample can be used to produce a plot of Stress vs. No. of cycle to failure.